
Reverse Engineering Gootkit with Ghidra Part I
March 23, 2019
Ghidra is pretty handy for looking at malware. This series of post is an informal overview of what I do. Gootkit is a great implant to learn the functionality of Ghidra. Gootkit is a NodeJS server with packaged Javascript implementing the implant functionality. There are lots of libraries linked into the main executable including Node, OpenSSL, and many more. As a reverse engineer it is difficult to identify and identify open libraries. In this post, I will go through my analysis process to use and understand Ghidra’s functionality.
I will first begin by basic code analysis, and understanding how to rename variables and types. I am going to avoid dynamic analysis initially, because dynamic analysis is something that you can buy or implement cheaply enough. In a real-world scenario I typically start dynamic analysis using a range of tools, then delve into the code as a secondary step.
The purpose is to learn Ghidra, not to do a great job at reverse engineering all of Gootkit. It is highly informal, and meant to be that way.
Ghidra All the Things!
There are now a few tutorials available on installing and configuring Ghidra Ghidra. Create a new project, and then import the decrypted rbody32 sample into the project. The sample I will be using is:
$ shasum rbody32.x.dec
6170e1658404a9c2655c13acbe1a2ad17b17feae
It is a decoded version of the file downloaded from a compromised Gootkit site. While Gootkit is the topic for this blog, this process can be applied generally to anything else.
Your import summary should look a lot like this:
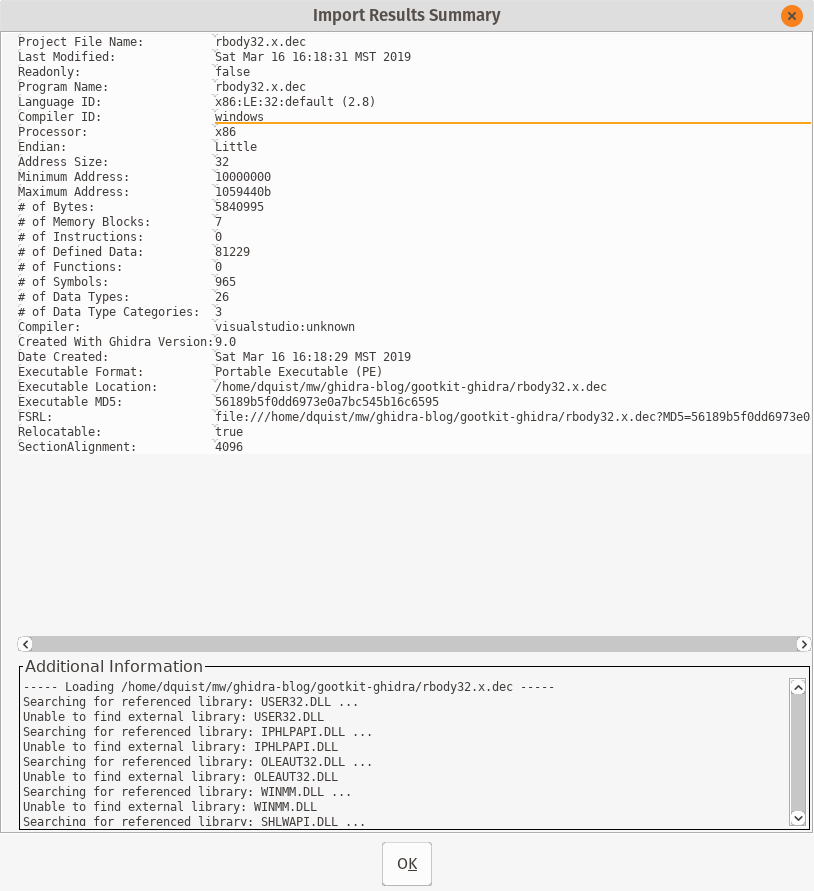 Figure 1: Ghidra import summary for the relevant Gootkit example
Ghidra Import Summaries
Import summaries tell you critically important facts about the sample that you’re looking at. The key thing to remember is that Ghidra is primarily a source code reverse engineering tool. There are a few salient bits to draw your attention to:
First, compiler identification. In this case Ghidra identifies VisualStudio:unknown as the likely compiler. This makes sense, as it is based off of a NodeJS, which is a C++ program, and Visual Studio is the compiler of choice for Windows. Knowing the compiler is important later when you’re puzzling through some obtuse assembly code, trying to figure out if the compiler generated some weird code, or the malware author was being tricky. Ghidra is excellent about identifying and categorizing compiler generated nonsense, and saves a bunch of time.
Second, Compiler ID appears to be the the platform that the compiler was run on. As you look at more assembly code, you’ll get a good idea of how each of them generate code for standard C and C++ programming patterns. My indicator when looking at code is whether or not it was hand-rolled assembly, or is compiler generated. Typically hand-rolled, artisinally crafted assembly is a good indication that there are shenanigans afoot. Hand coded assembly can be significantly more difficult to understand, where a compiler will try to do things the same way.
Why do I care so much about compiler produced versus hand-coded assembly? As an analyst, you have a budget of time and attention that you can focus on every bit of code. During an investigation I tend to hit a point of diminishing returns where fatigue sets in, and I start to miss critically important details. The code placed around checking return values and stack canaries is something I spend way too much time classifying in a sample. If a tool can identify that, I can label it as not important and go on with life. If the tool does not identify that, or more likely I get drawn in anyway, there are all sorts of suspicious APIs that are very distracting. ExitProcess, anything thread related, etc.
Additional information is an excellent resource too. Looking at the high-level DLLs the sample is using can give you an idea of what the functionality is going to be.
Existing Gootkit Research
Largely this document will consist of reproducing the already existing Gootkit analyses. Gootkit is served from a compromised host and runs a small command and control server. The user is tricked/hacked into downloading a compromised PDF/DOC/implant, which then contacts the call-home server. Generally if you see .*/rbody32 or .*/rbody320 in the URL, you’ve most likely got the right sample.
@jgegeny has a copy of the extracted JavaScript files. The functionality signatures, and overall path to success depends on understanding the JavaScript. I will focus on trying to extract them.
In general the things you need to know about Gootkit:
- It’s based on a all-in-one compiled version of a NodeJS application. If you ever needed a more clear and present indication that Node is evil, look no further
- It has a second DLL inside of it to handle password and credential harvesting.
- All of the functionality exists as JavaScript files, which we would like to decode and obtain.
Analyzing Gootkit
Analysis Goals
- Generate new indicators of compromise
- Find attribution information for the authors
- Show the functionality of Ghidra
- Extract all the Javascript code
Assumptions
- There is Javascript hiding inside Gootkit, and is a good source for IOCs.
- The JavaScript files are probably compressed or encrypted.
- The Password Grabber DLL is also embedded in this binary
Double-click the rbody32.x.dec inside of the project view and enjoy the 1337 dragon graphic animation. The answer to “would you like to analyze now?” is always yes.
 Figure 2: An exercise in clicking the Yes button until something happens
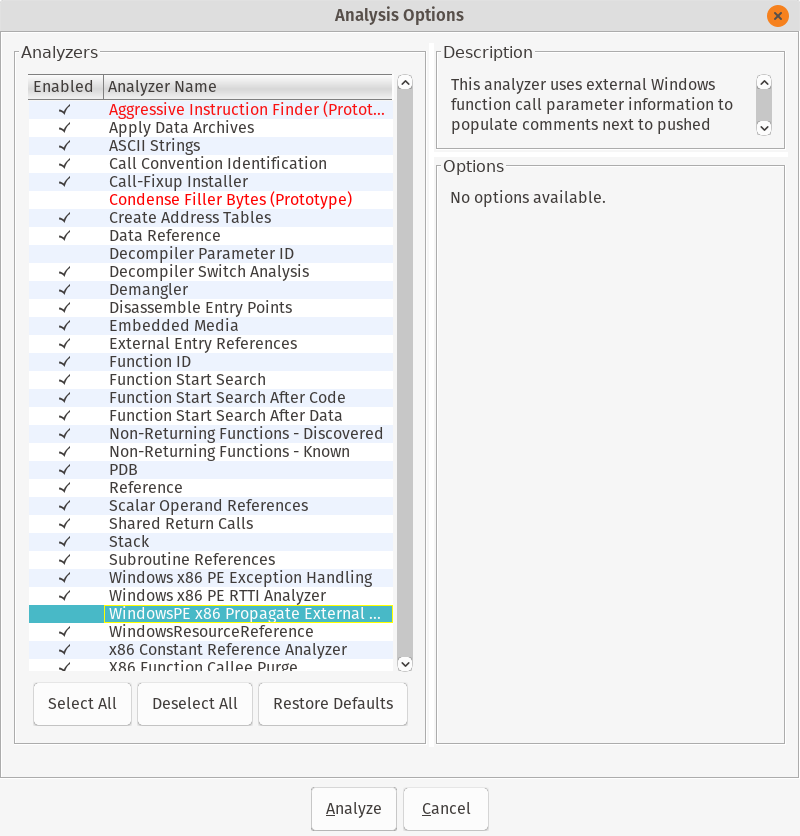 Figure 3: Be sure to select ‘Aggressive Instruction Finder’ and bravely ignore all the warnings.
Ghidra Analysis Options
Figure 3 shows the analysis options that Ghidra has available. Similar to IDA, you should most likely ignore these individual settings and just accept the defaults. (The exception being Aggressive Instruction Finder)
Looking at some of the default options, there are all sorts of goodies available. I’ll go through my favorites so far:
- Apply Data Archives - Search for embedded archive formats, and display information about them. Have a blob of zip/base64/lznt1 data you find? Ghidra looks for these as well and calls them out.
- Embedded Media - More often than not, especially if your sample is trying to impersonate a benign program, you’ll find media or other sheisty information embedded. This will create bookmarks for you to later use and analyze.
- Windows .* - All of the internal things that Windows compilers use to make life difficult. Previously these all had to be waded through individually. Now Ghidra will figure them out, add salient information to the analysis, and generally save you time.
Hopefully in the time it took you to read the above, your analysis is finished. Let’s jump right into analyzing the GUI and starting to use our workflow.
GUI Overview
After all the analysis is completed, you should be presented with the business end of Ghidra, it’s GUI. Take in the Windows 95 era Java Swing GUI, and remember a time when you could hot-patch the page fault handler without the Windows kernel immediately labeling you as a malcontent.
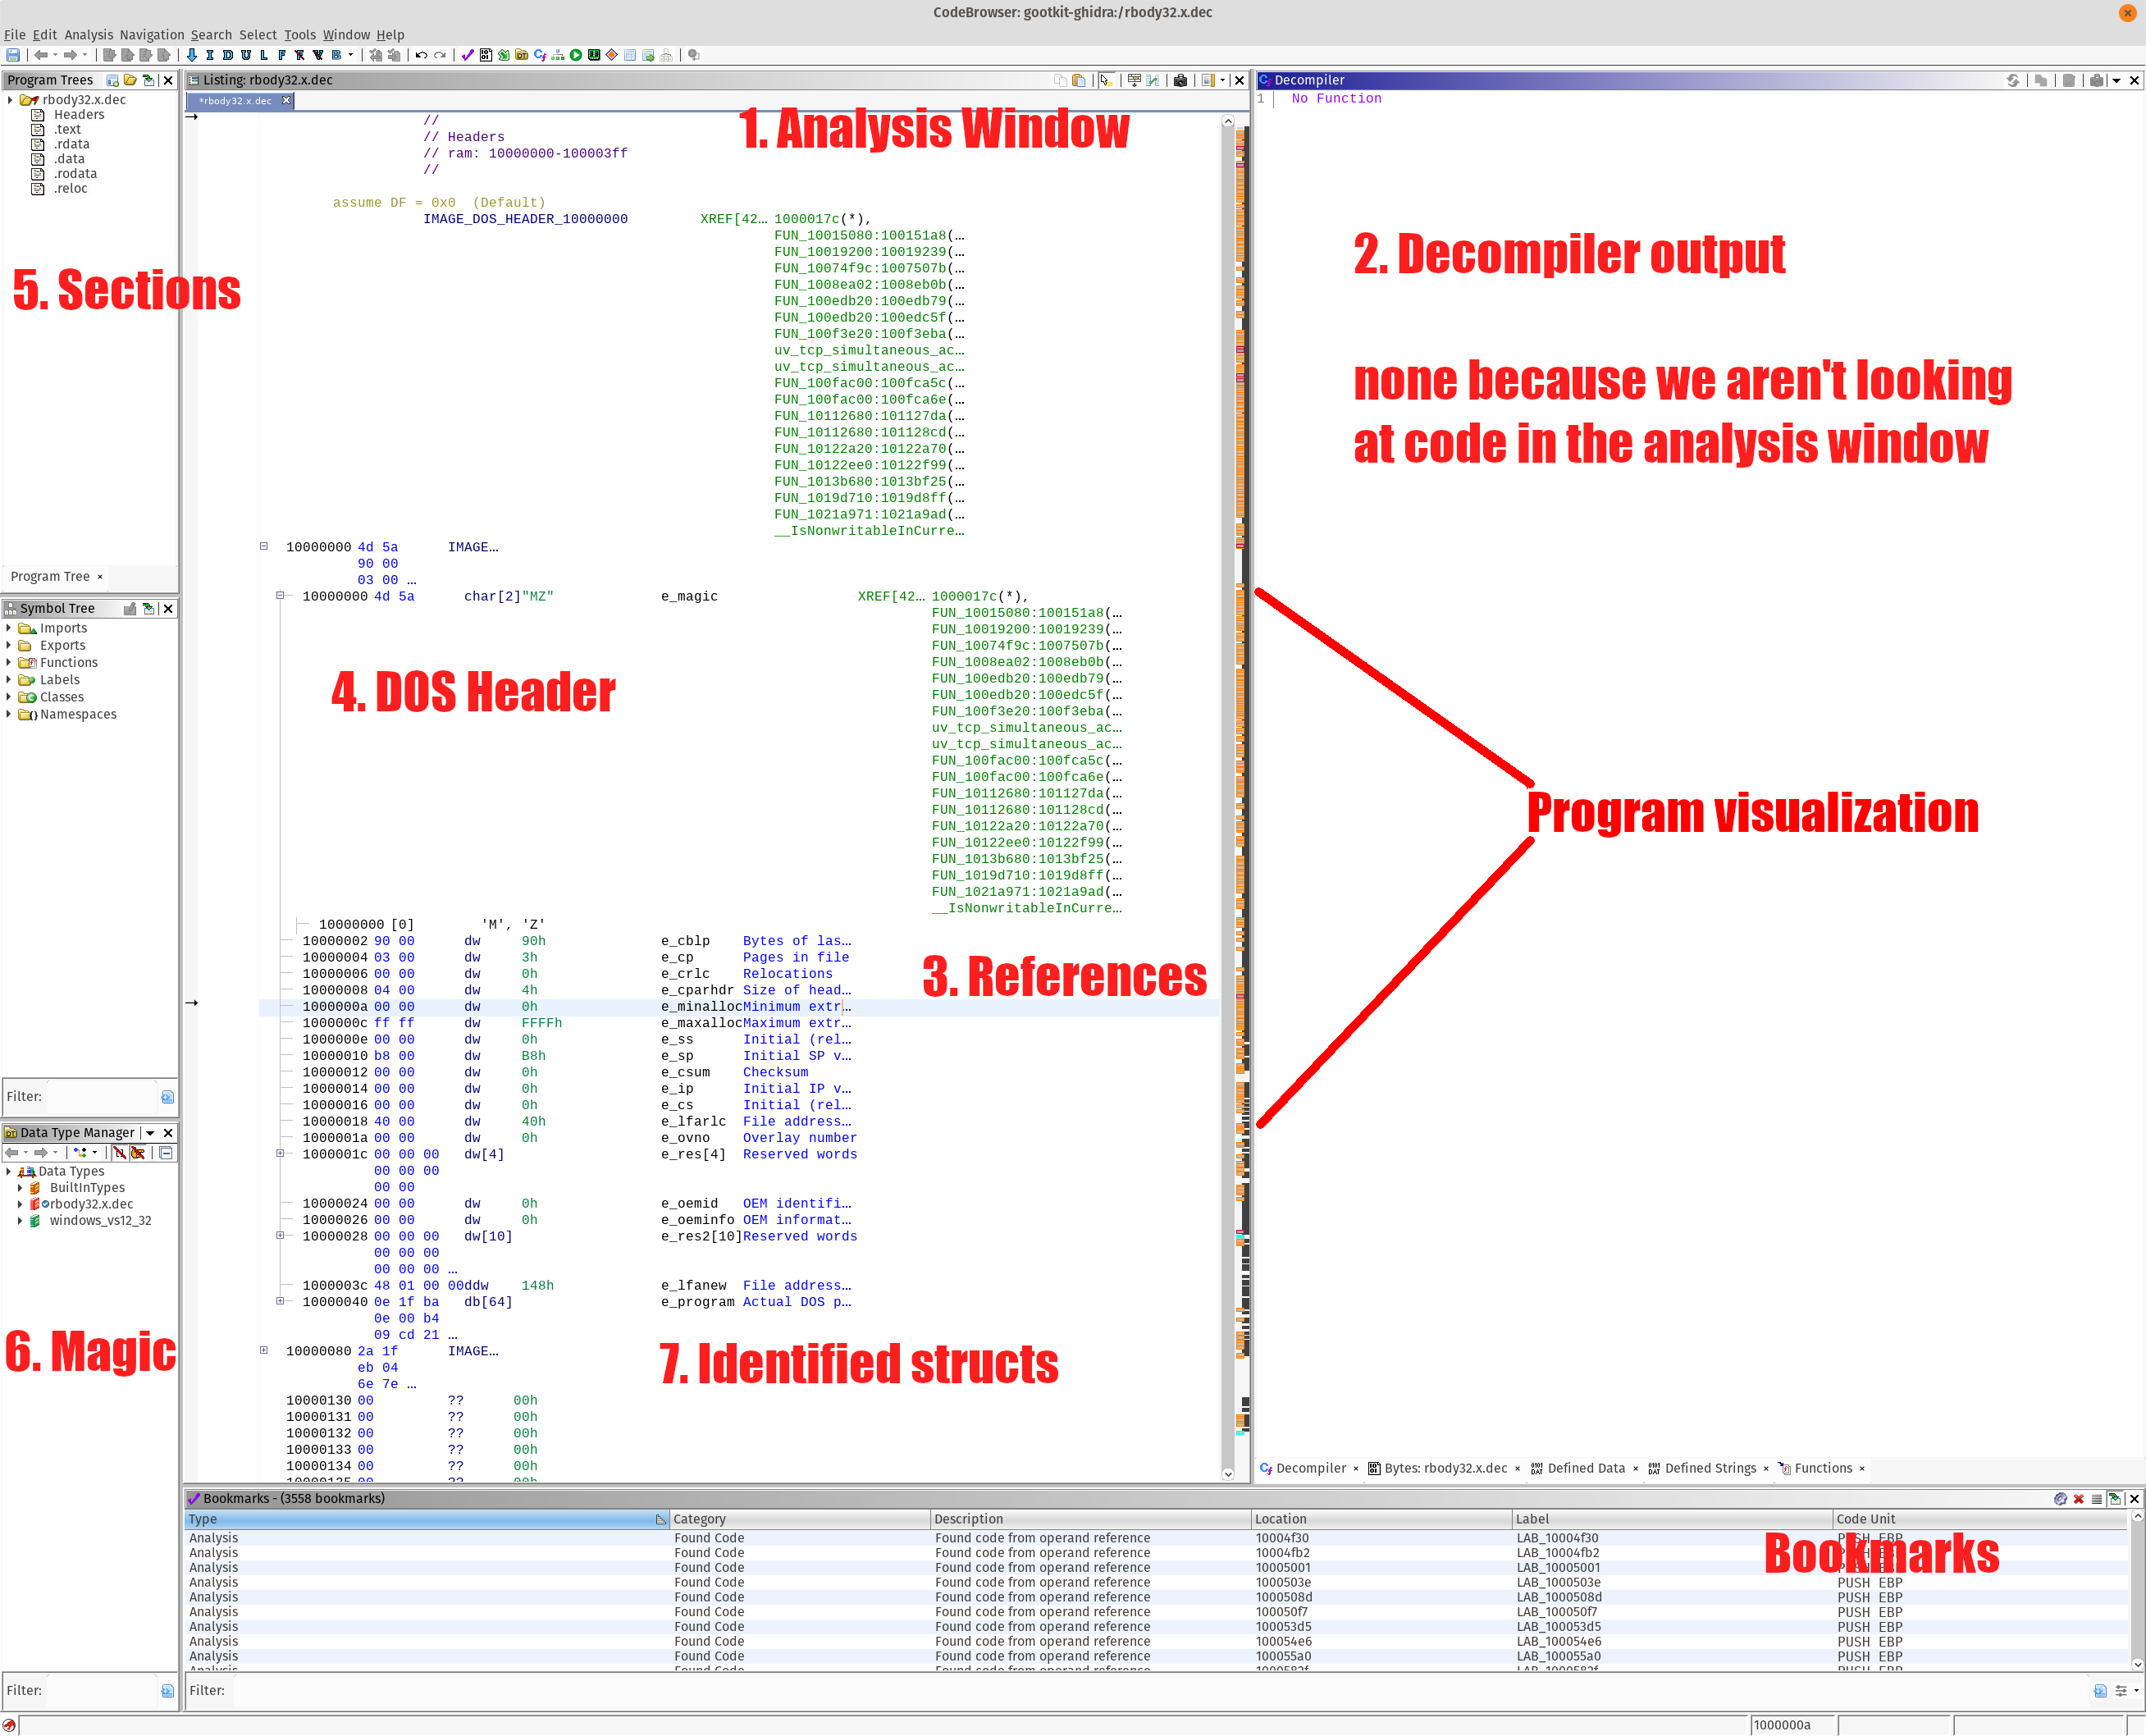
Figure 4: First view of the GUI with annotations. Clean version without the annotations can be found here
Enable Entropy Visualization
This is a cool trick that saved me a lot of time. Enable entropy visualization. Click the drop down menu on the top right of the Listing view, and select “Show Entropy.”
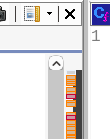
Figure 5: Click the pulldown to enable entropy visualization
Entropy, or the measure of randomness is useful for identifying encrypted or compressed portions of the executable. This is probably a good time for you to learn some math if you’re not already familiar. Wikipedia provides a good overview of Entropy if you’re into that sort of thing. All you need to know is that the higher the entropy (red in this case) means that there is likely a compressed, or encrypted blob of data. Goal 4 of our analysis goals is to extract the compressed JavaScript, so this is a good place to start looking.
Entropy does not always mean compressed or encoded data, nor does it mean that all encoded or compressed data is high entropy. All things being equal, it does mean something you should take a look at. In general, it’s a good place to start looking and I appreciate that Ghidra includes this as a default option.
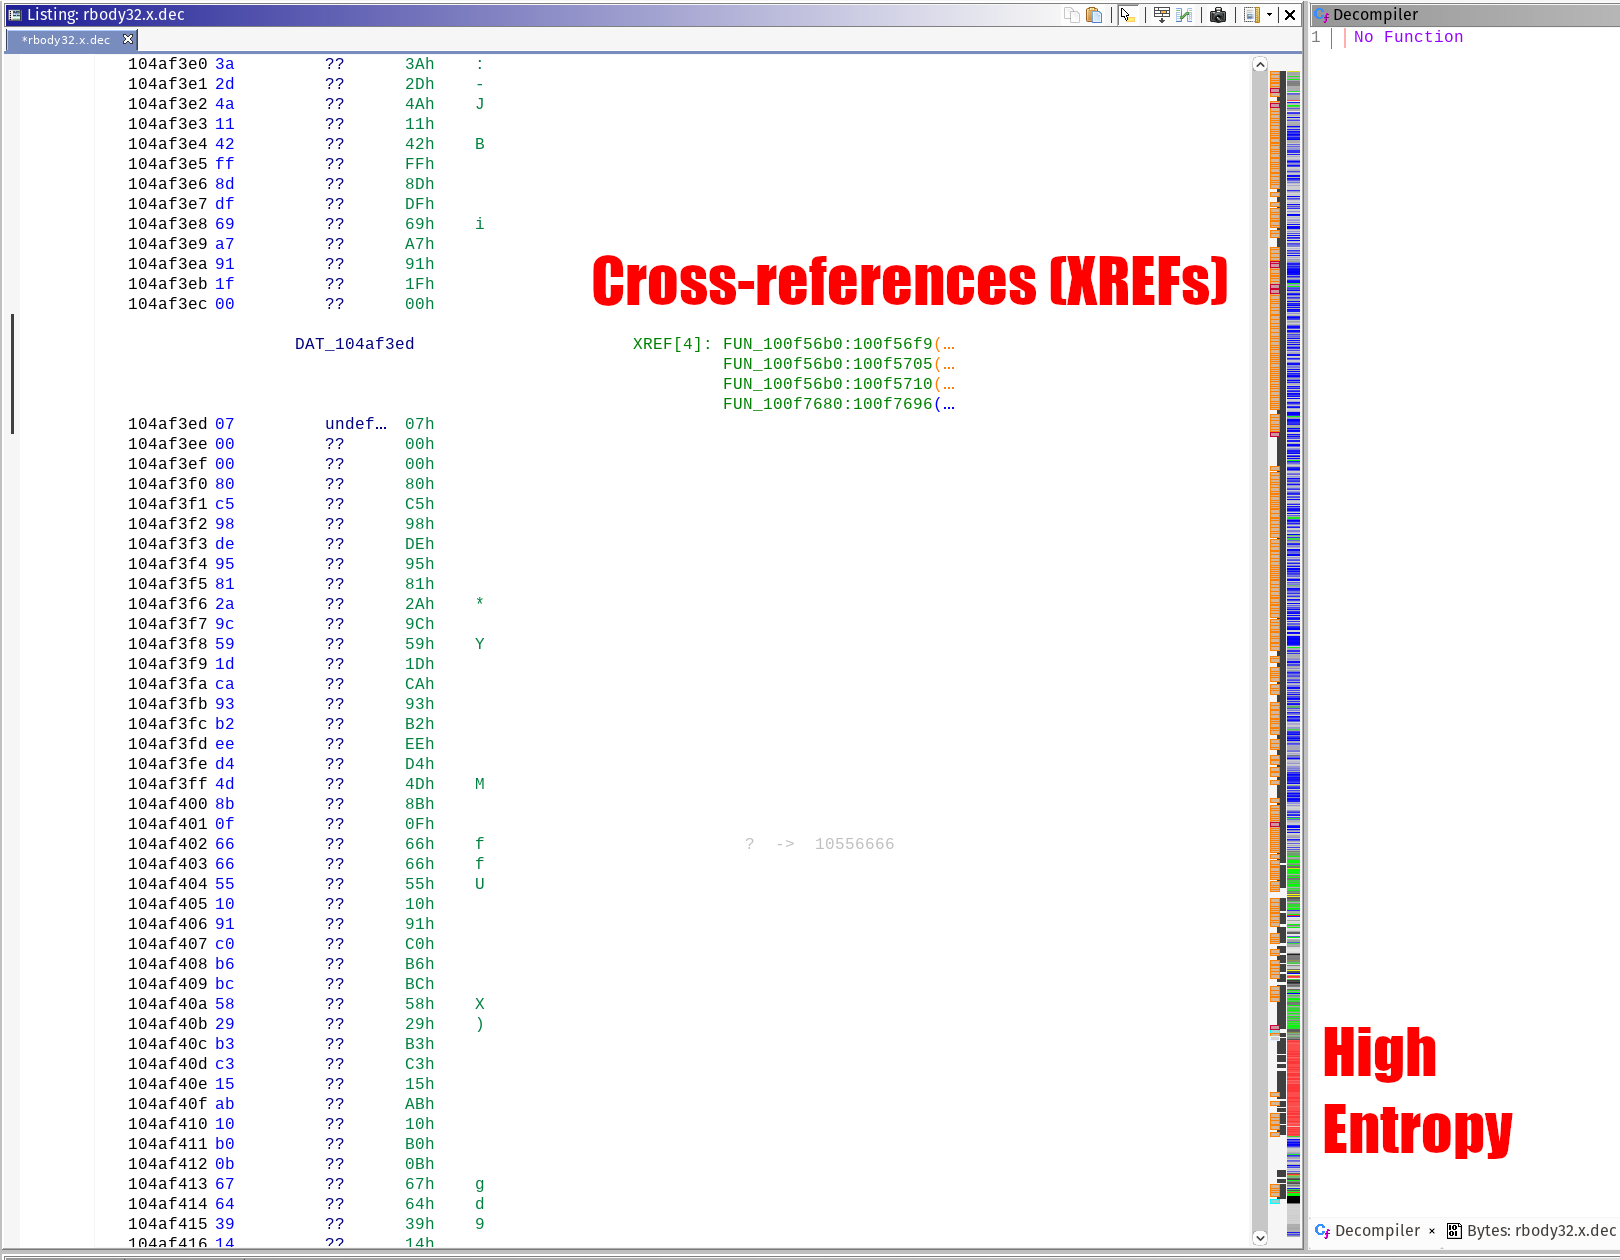 Figure 6: The code listing with the high-entropy portions
Analysis: Find the Embedded Code Part 1 - A Failure
Now that we have a good entropy visualization, let’s try and take a shortcut to finding the compressed code.
Inspect the High Entropy Areas
If you click next to the red area in the executable, you should see a reference to the entropy being somewhere close to 8 in the tool-tip pop up. Select as close to the top as you can, then scroll the code view up until you see references to functions. Why functions? Because the address cross-references (XREFs) can contain random data, and not necessarily what you’re looking for. Code references are where the executable is looking at that specific address. From here we will inspect all of the XREFs and look for anything that looks like encryption.
What does encryption code look like? This is a hard question. One way to answer that is to compile a bunch of encryption reference code, and look at what code is generated. In the end a couple of rules-of-thumb apply:
How to find encoding, encryption, and obfuscation the hard way
- Is there an xor with differing operands?
xor eax, 0x42would be an example, andxor eax, eaxwould not. - Are there lots of shift instructions in the same code? The
shlandshrinstructions being the most notable - There’s a noticeable loop structure
- Data is modified, and stored somewhere else in the program
With an eye on those details, I will inspect each of the listed cross references to see if I can infer what the compressed code is.
The first reference occurs at address 0x100f56f9 inside of FUN_100f56b0, and is a good example of what we are not looking for.
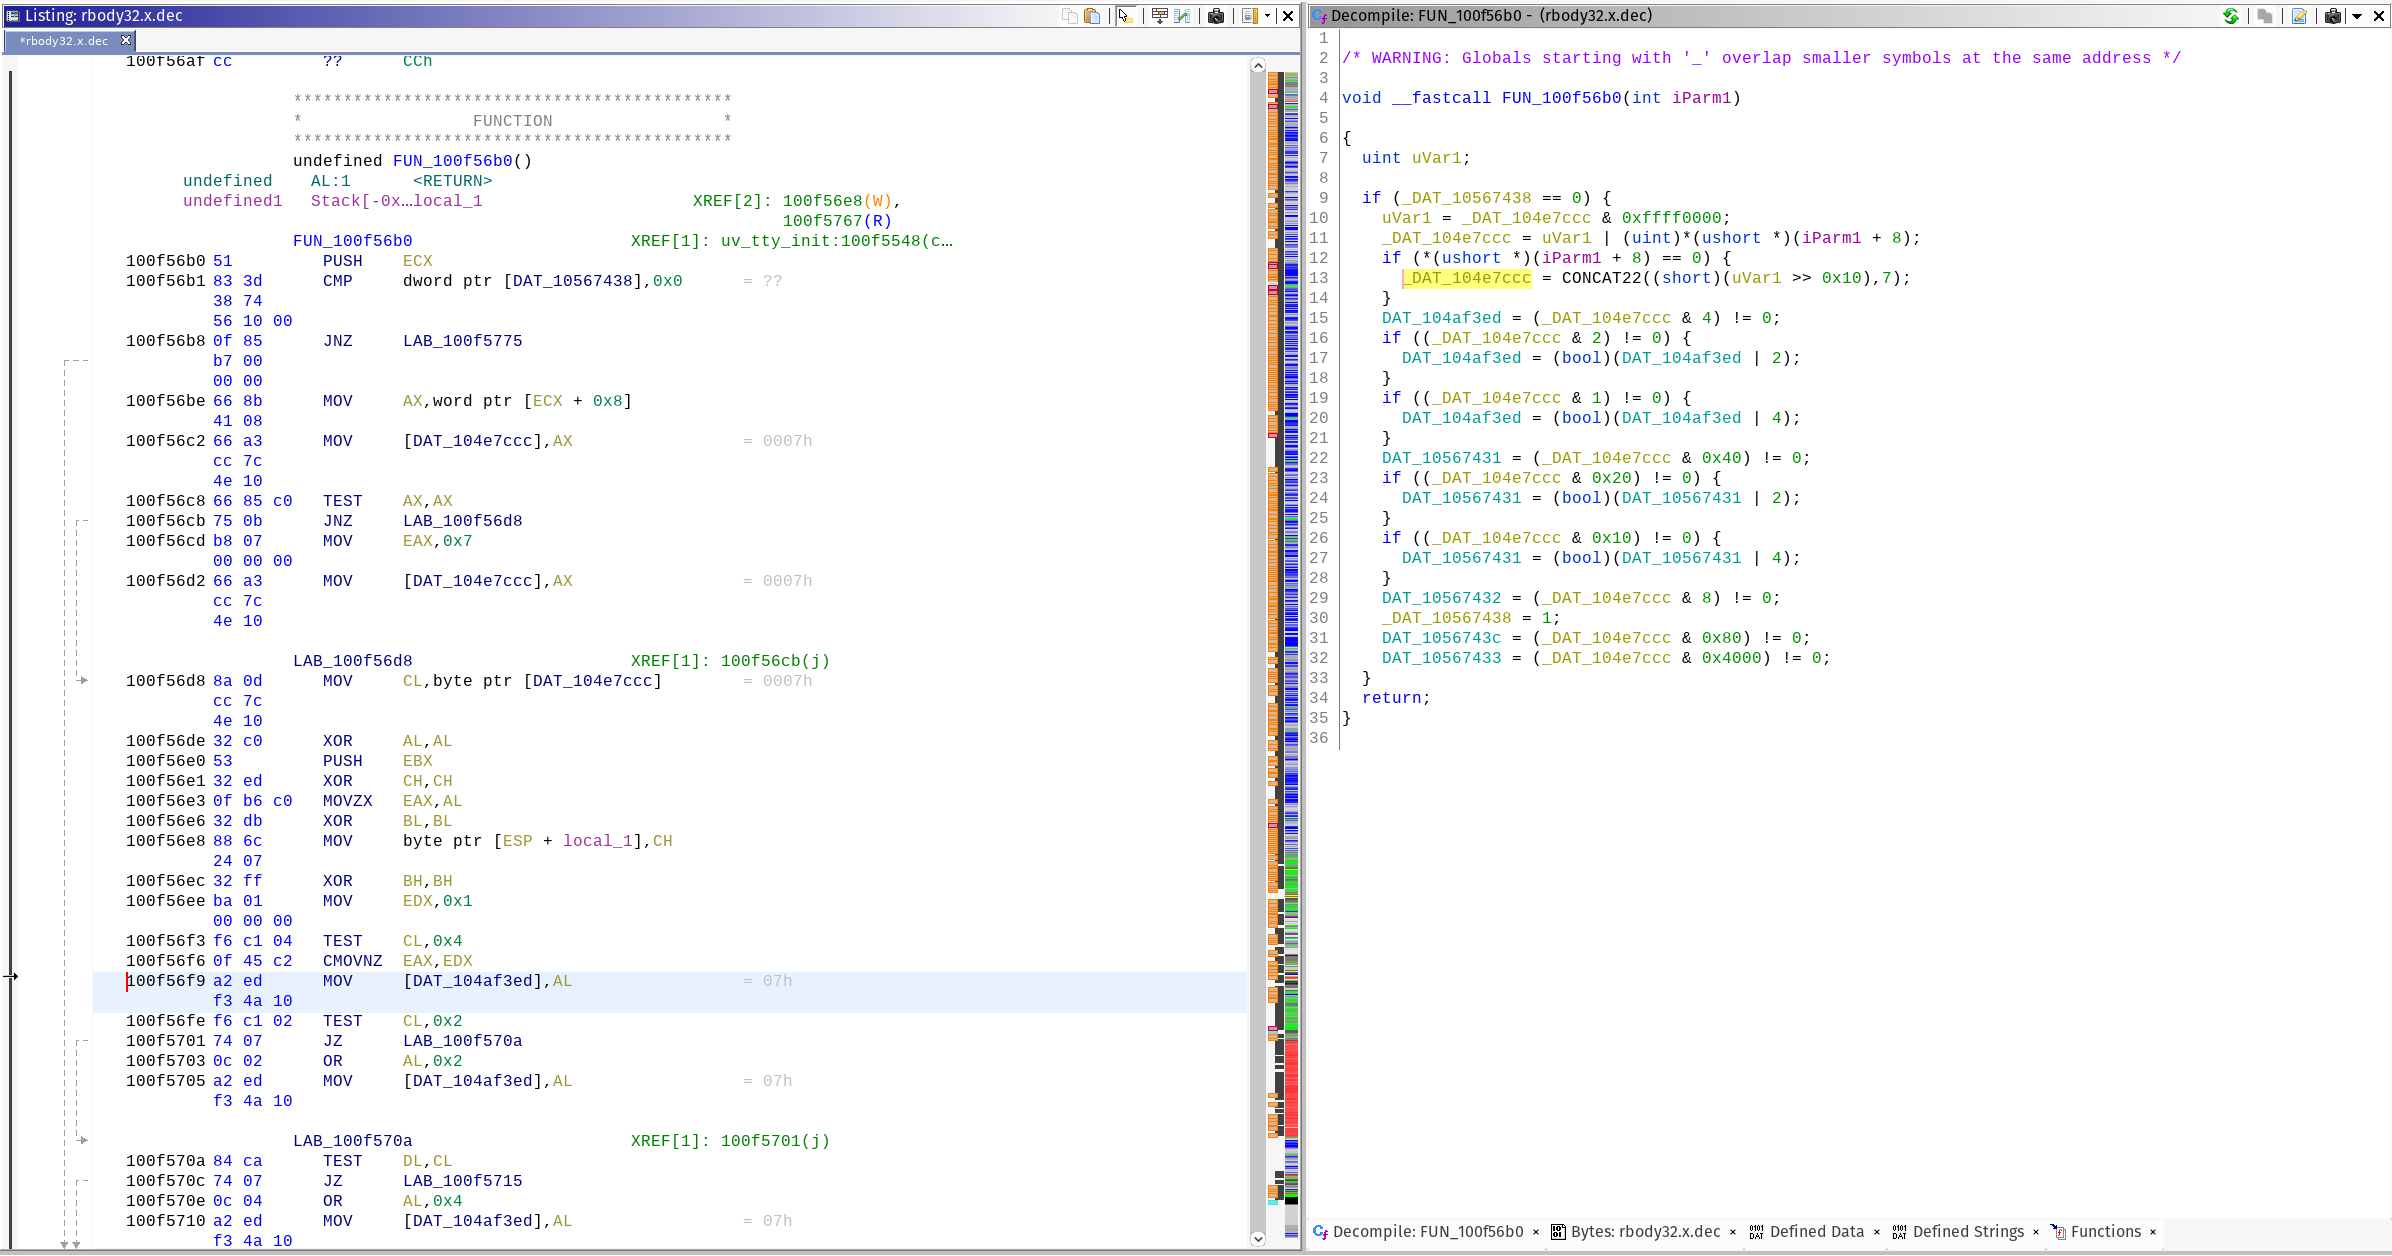
Figure 7: FUN_100f56b0 assembly view and its decompilation
Rename Global Variables and Functions Using ADD
The first thing to do is to change the name of DAT_104af3ed to something more noticeable. Since reverse engineering is all about abductive reasoning, I’m going to assume (abduct) that this is compressed or encrypted code. If any facts present themselves that contradict this assumption, I will modify my assumption and subsequently change the variable name to match my new assumption. Abductive reasoning is a good lifestyle choice, but that’s a highly personal matter. In the grand effort to increase global information entropy, confusion, and make a slightly offensive joke I call it Abductive Data Describer (ADD) workflow.
Gaze Upon the Magnificence of the Decompiler
You should notice that the decompilation window now has code in it. You may also notice that there are no gotos in this code. Further inspection will reveal that aside from automatically assigned labels, the code looks more or less reasonable. When I first reversed Gootkit with Ghidra and saw this decompilation, I had a very Jodie Foster in Contact moment when I first saw the decompiler working. Decompiler quality is informally judged by how many gotos produced instead of the more common if/else/switch/throw/catch statements. C and C++ developers are threatened from birth against using gotos, except in some very narrow circumstances, so a decompiler using them is akin to taking a shortcut. In practice I have found that once you fully fill out the types of all the variables, the decompiler outputs legible C code. Programming idioms and patterns matter, so it’s a good idea to study them.
Let’s rename a variable using our ADD workflow:
Figure 8: Rename the variable pointing to the high-entropy code to something more descriptive
Rename your Functions
This function is most likely not what we are looking for, however we have invested some time in looking at it. It’s a good idea to rename the function any time you have a high-level concept you’re looking for. My names tend to be pretty descriptive, and describe both my confidence in and the contents of the function. I use uncertain names like some_xors_and_bitshifts to imply how much time I’ve spent on it. Later I’ll change it to something more specific if I spend more time on it, like high_entropy_flag_mod() and actually know what it’s function is.
There is no xor instructions, and there is no loop. Likely this is a helper function that is looking at the flags of the data. It’s a good idea to rename functions with your best guess (ADD), so I’m going to do that. I’ve also relabeled this function as high_entropy_flag_mod().
Rename your variables
If you figure out the types used in a code sample, you can redefine those as well using CTRL-L, or right-clicking and selecting ‘Retype Variable’. The more correct information you provide about the types, the more accurate the decompiler output will be.
Next function! To get back to the data view, click the left arrow button until you see the view again. This works similar to the escape key in IDA and Binary Ninja. If you renamed the function, your listing should look like this:
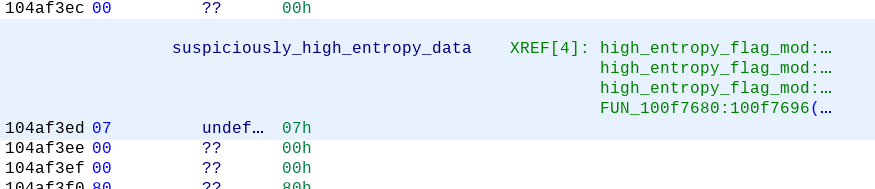
Figure 8: The updated code listing once you have renamed the referencing function
Notice that all but one of the functions has been renamed, reducing how many functions you need to analyze. There is only one remaining, FUN100f7680 and it bears inspection. The decompiler shows that a lot of our encryption qualifications are met: xors, bit shifting, and even a do {} while () loop! Upon further inspection, the only xor in the code is at the very top of the function. This is a trick that Visual Studio uses to prevent stack based buffer overflows called a Canary. If you see an xor at the beginning of a function, this is most likely what it is. Similarly, there will be a subsequent function call that reverses the process, and exits the program.
Further inspection of the function shows that this is just a flag checking algorithm inside of a loop. Rename the function (I used high_entropy_loop_flag_check()) and move on. A good next step is to look at the XREFs for the function, and look at the parent code. I only saw one XREF FUN_100f7bc0 so that is the next target.
Inferring Functionality using API Calls
The first thing I noticed about FUN_100f7bc0 are the API calls being made. These function calls give us an idea about what the program is being used for. Looking up API calls on MSDN will give you an idea about what the developer is doing.
| API Call (MSDN) | Typical Usage |
|---|---|
| WaitForSingleObject | Wait until the specified object is available or times out. Typically used to implement a Mutex, Semaphore, or other multiprocess primitives |
| MultiByteToWideChar | Convert a multi-byte character to a ‘wide’ character. Unicode in Windows is full of pain and misery due to an early Windows design decision to ignore Unicode |
| WriteConsoleW | Write a buffer to the console. The W stands for ‘wide’. An A at the end would indicate an ascii string |
| GetLastError | Why did my last function return an error? The Linux pattern is to use errno then bitteryly complain about reentrancy issues |
Table 1: A listing of API calls found in FUN_100f6bc0
Conclusion: This is OpenSSL
I quickly came to the realization that despite my initial hopes, this is not a decryption function. I follow a similar renaming process for all of the referenced functions, until everything is renamed. This particular branch of code seems to focus on outputting data to the terminal.
Sometimes you win, and sometimes you lose. I figured out I was in the wrong area when I scrolled a bit further down in listing and saw this jump out at me:
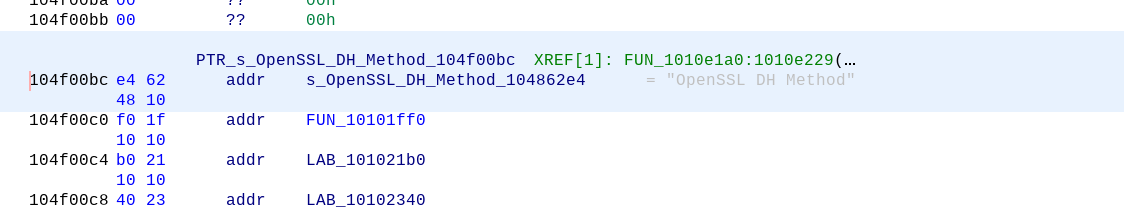
Since the implant portion of Gootkit is packaged Javascript with an embedded NodeJS server, which uses OpenSSL, this is likely just a statically linked copy of the OpenSSL code. In other words, a false lead.
Next Steps
In the next post, I will go over Ghidra’s binary diffing feature and see if it can help identify embedded libraries.